The Waterfall section of GTmetrix displays the request-by-request loading behavior of your website: every script, media file, and third-party resource your page requests.
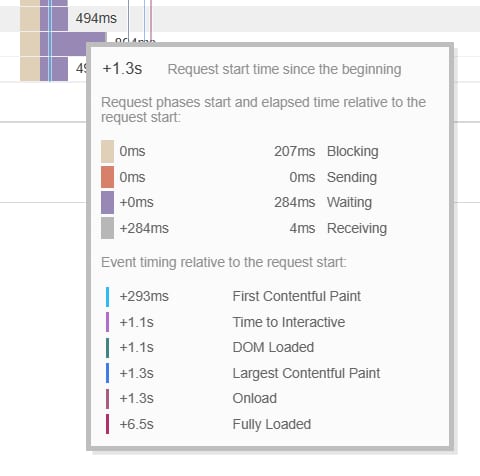
Each website element is indicated on the main graph with the exact time it took to load:
If the report shows errors like 404 or 403, they might indicate an issue on your website that can increase its loading time. You can also hover on the waterfall itself to find more details:
If you are a registered user, you can also check the resource usage graphs:
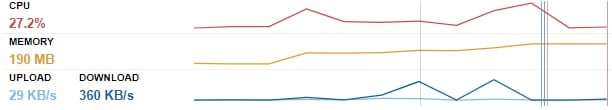
A high CPU or memory usage in the Waterfall might indicate that you are exceeding the resources of your hosting plan. Learn more: Order Usage section in hPanel.
Additional Resources