Checking VPS resources usage
Navigate to the VPS section on hPanel and click Manage next to your chosen server. Then, open the Backups & Monitoring section on the left side panel and click on Server Usage:
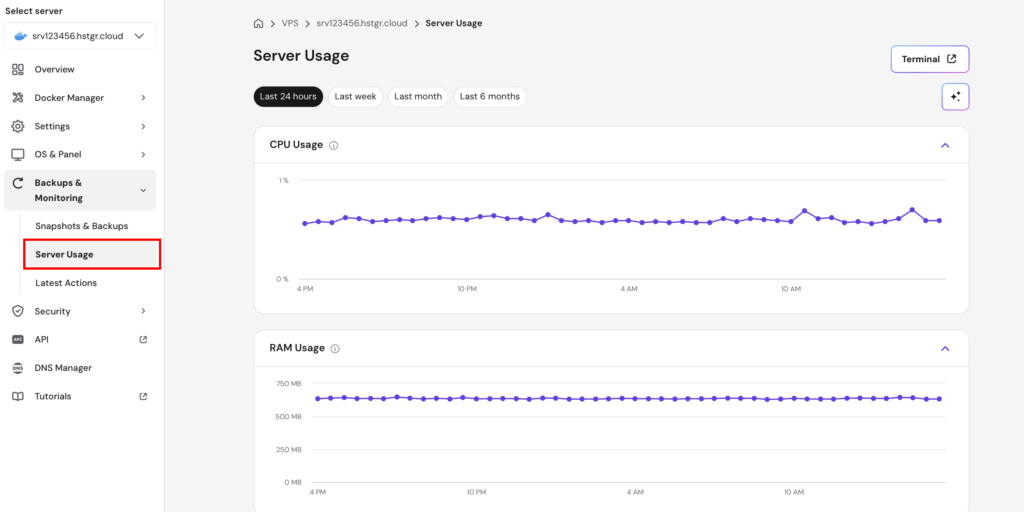
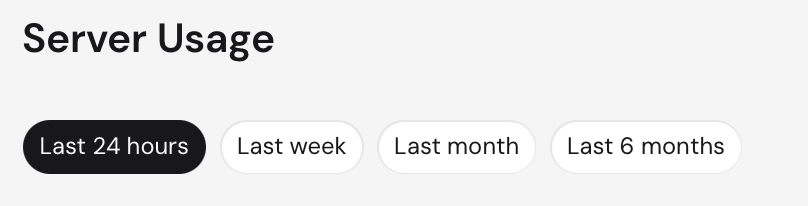
Choose the period you’d like to analyze: the last 24 hours, week, month, or year:
Below, you’ll find several graphs with the main VPS metrics.
The graphs in the Server Usage section use the GMT+0 timezone 💡
CPU usage
CPU usage displays the amount (in %) of CPU power consumed by your server:
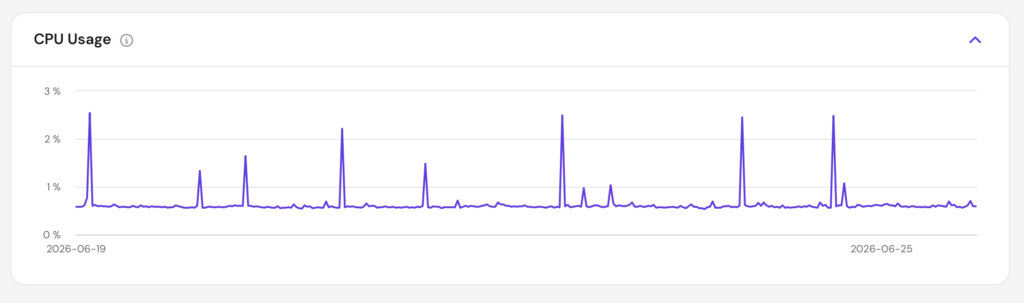
It’s completely normal if CPU usage is high from time to time. It can increase when you’re installing resource-heavy applications or when your VPS is processing a lot of data.
When you see that your CPU usage keeps increasing, you can find the processes that cause the high usage and use our VPS AI Assistant to get insights on how to address the cause.

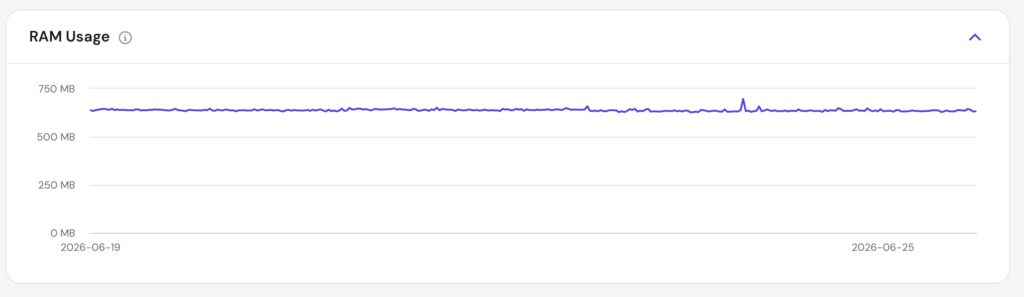
RAM usage
RAM usage displays the amount of memory (GB) that’s used by your server’s processes:
RAM and PHP memory are not the same. To learn more about it, check this article: What Is the Difference Between PHP Memory Limit and RAM? 💡
Disk space
Disk space shows the amount of data (GB) held in the disk of your server:
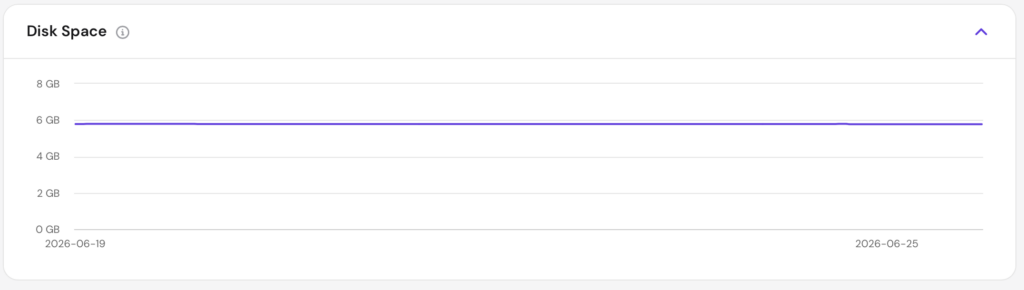
If you notice your disk usage is high, you can investigate further via SSH. The following commands help identify what is consuming disk space:
Check overall disk space:
df -hThis shows total, used, and available space for each mounted filesystem.
Find the largest directories:
du -sh /* 2>/dev/null | sort -rh | head -20Lists the top 20 directories by size, starting from the largest.
Find large files in a specific directory:
du -sh /var/log/* | sort -rh | head -10Useful for spotting oversized log files, which are a common culprit.
In case you are worried about disk space, you may enable disk quota and limit the amount of space your files take.

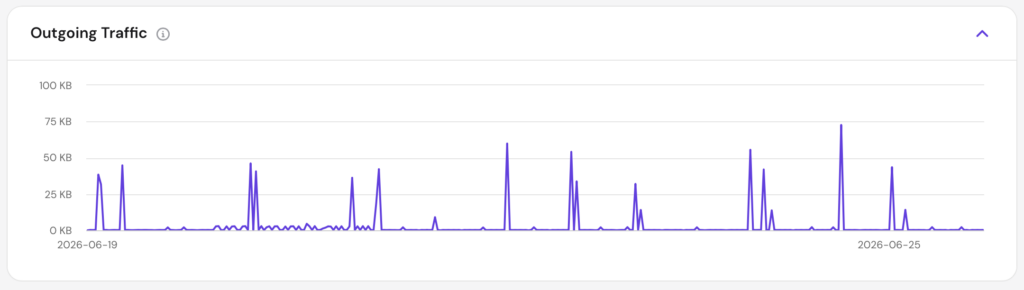
Outgoing traffic
Outgoing traffic shows connections from the server to a remote location:
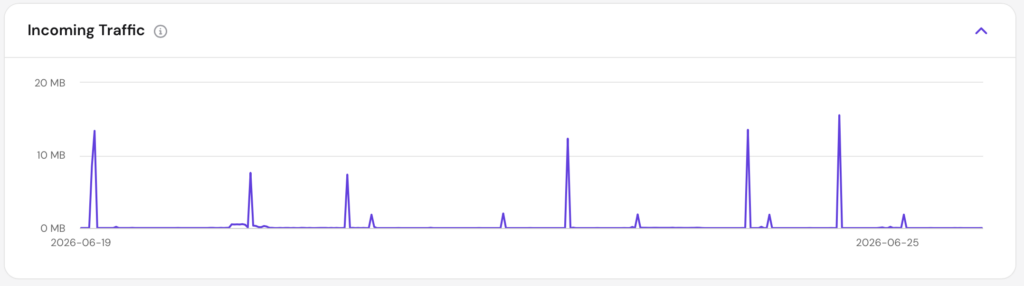
Incoming traffic
Incoming traffic shows connections coming into the server from a remote location:
Reducing VPS resources usage
High usage of your VPS resources usually comes down to poor website optimization. This can be solved by considering the following aspects:
The physical distance between you and the server
The bigger the distance between you and the server your website is hosted, the longer response time you may expect. To solve this, we recommend you set up a CDN or content delivery network. It works by keeping multiple copies of your website’s data in proxy servers worldwide, thus improving your website speed for visitors, no matter their physical location.
Although, for instance, if you and your target audience are from the USA, and your server is in Asia, a CDN might not help much. Instead, you may contact the Hostinger Customer Success team, and request transferring your hosting to a closer location.
Poor optimization of database queries
Optimizing how queries are made, seeking only the essential data, or limiting the query results is the way to go when it comes to query optimization. There are tools that help in this matter, e.g., EverSQL. Additionally, you may find useful information in various forums or blog posts, like this one: Supercharge Your SQL Queries for Production Databases 💡